


In today’s fast-moving markets, having a solid trading strategy isn’t optional—it’s essential. Prop traders who consistently succeed don’t rely on luck or hype. They use well-tested strategies that balance risk, align with their trading style, and fit within the rules of professional prop firms.
Below, we break down five actionable trading strategies used by top-performing traders—each one designed for intraday and scalping, with tight risk management, clear criteria, and adaptability across different market conditions.
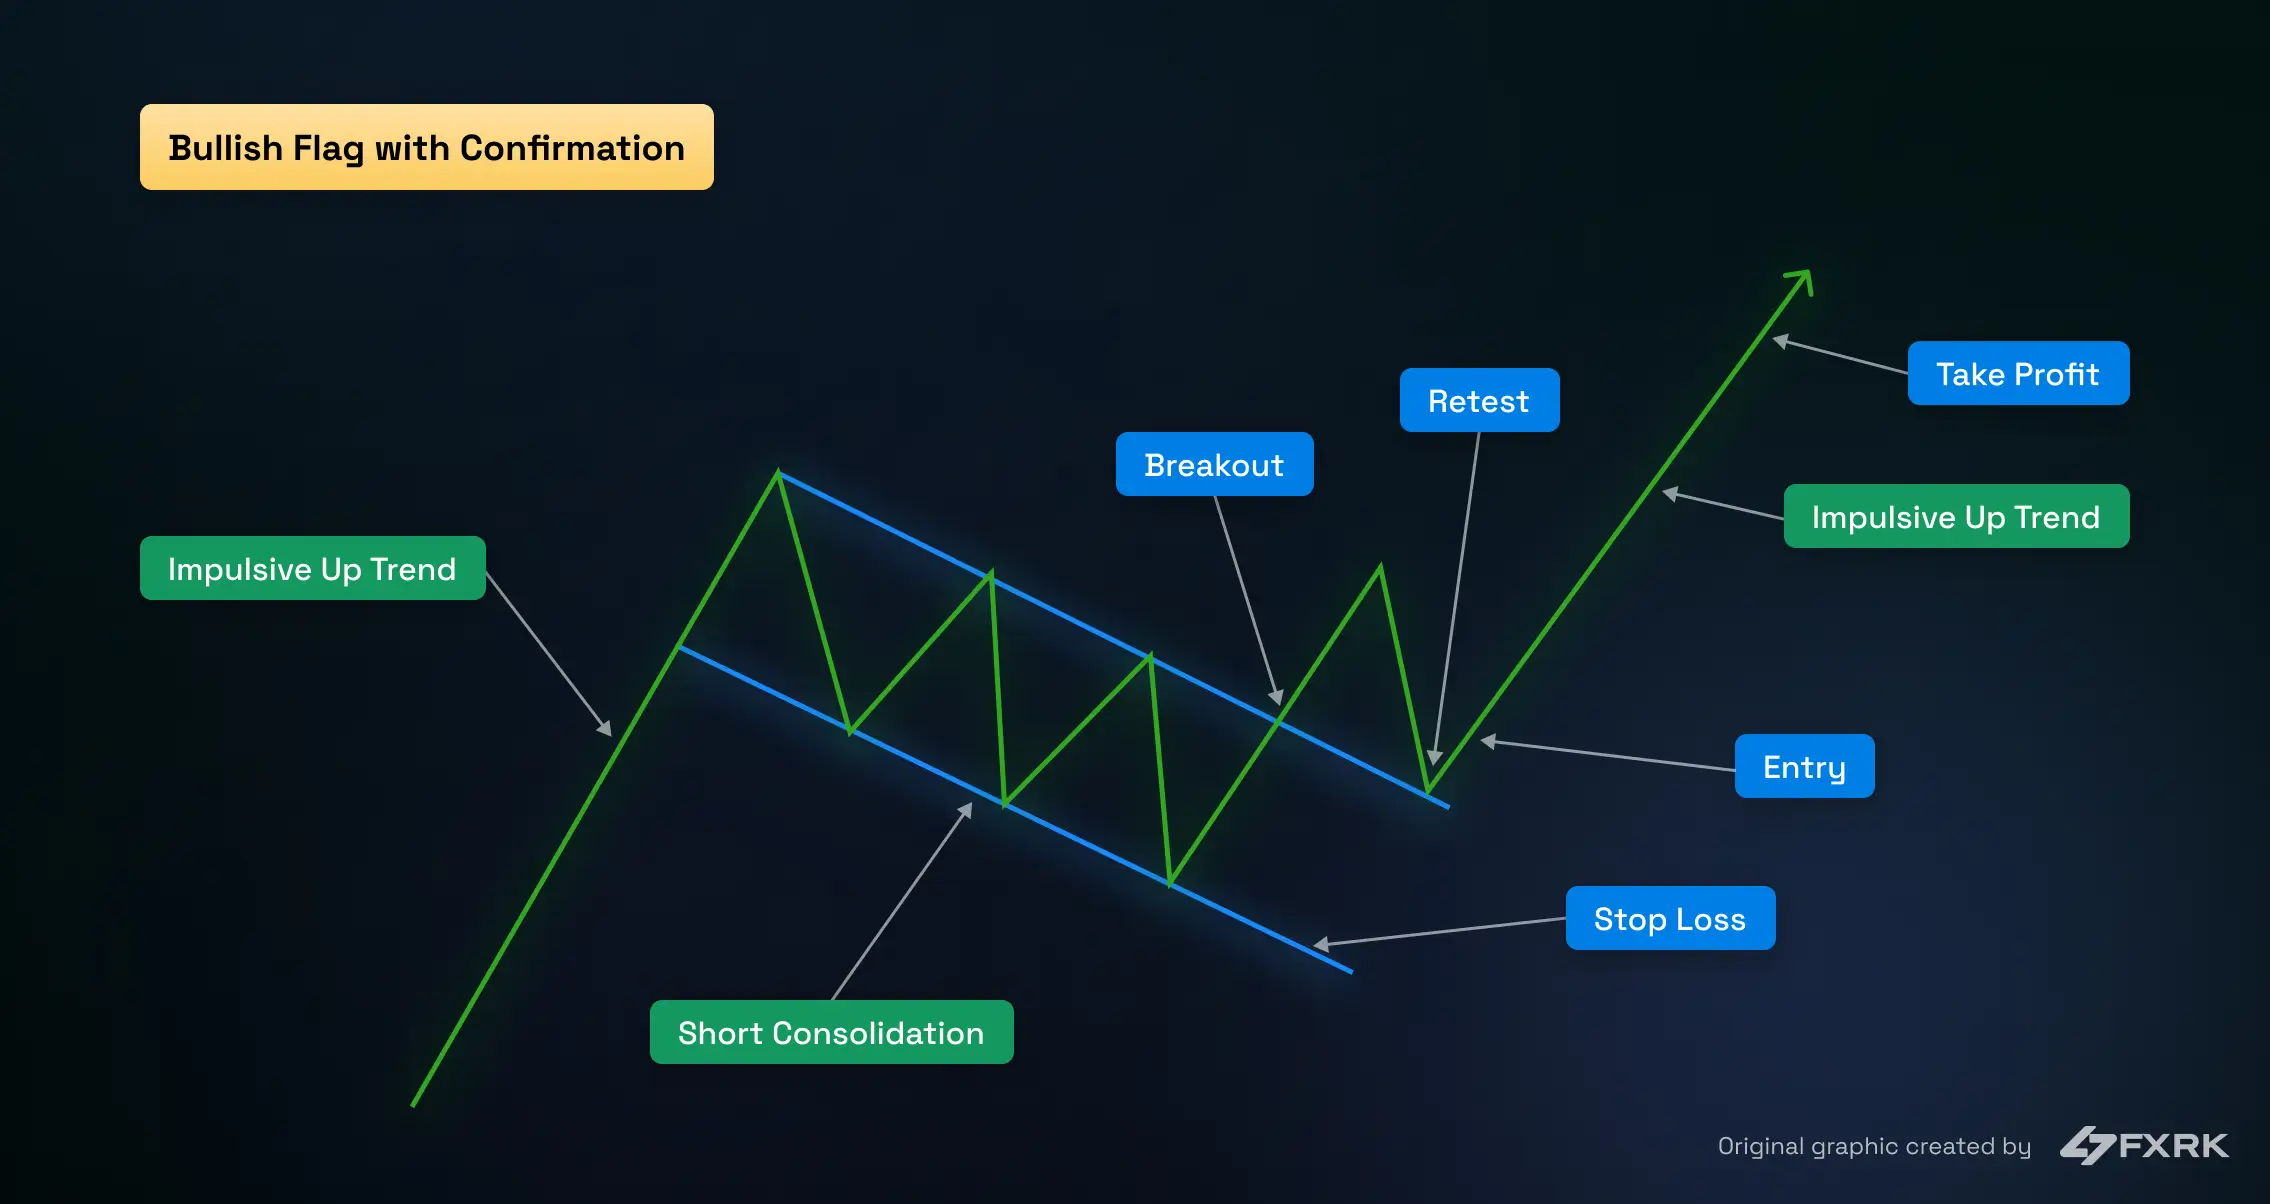
1. Bull Flag Pattern
A bull flag is a continuation pattern that forms after a strong impulsive uptrend, followed by a period of tight consolidation that slopes against the main trend. This pause allows the market to breathe before resuming higher.
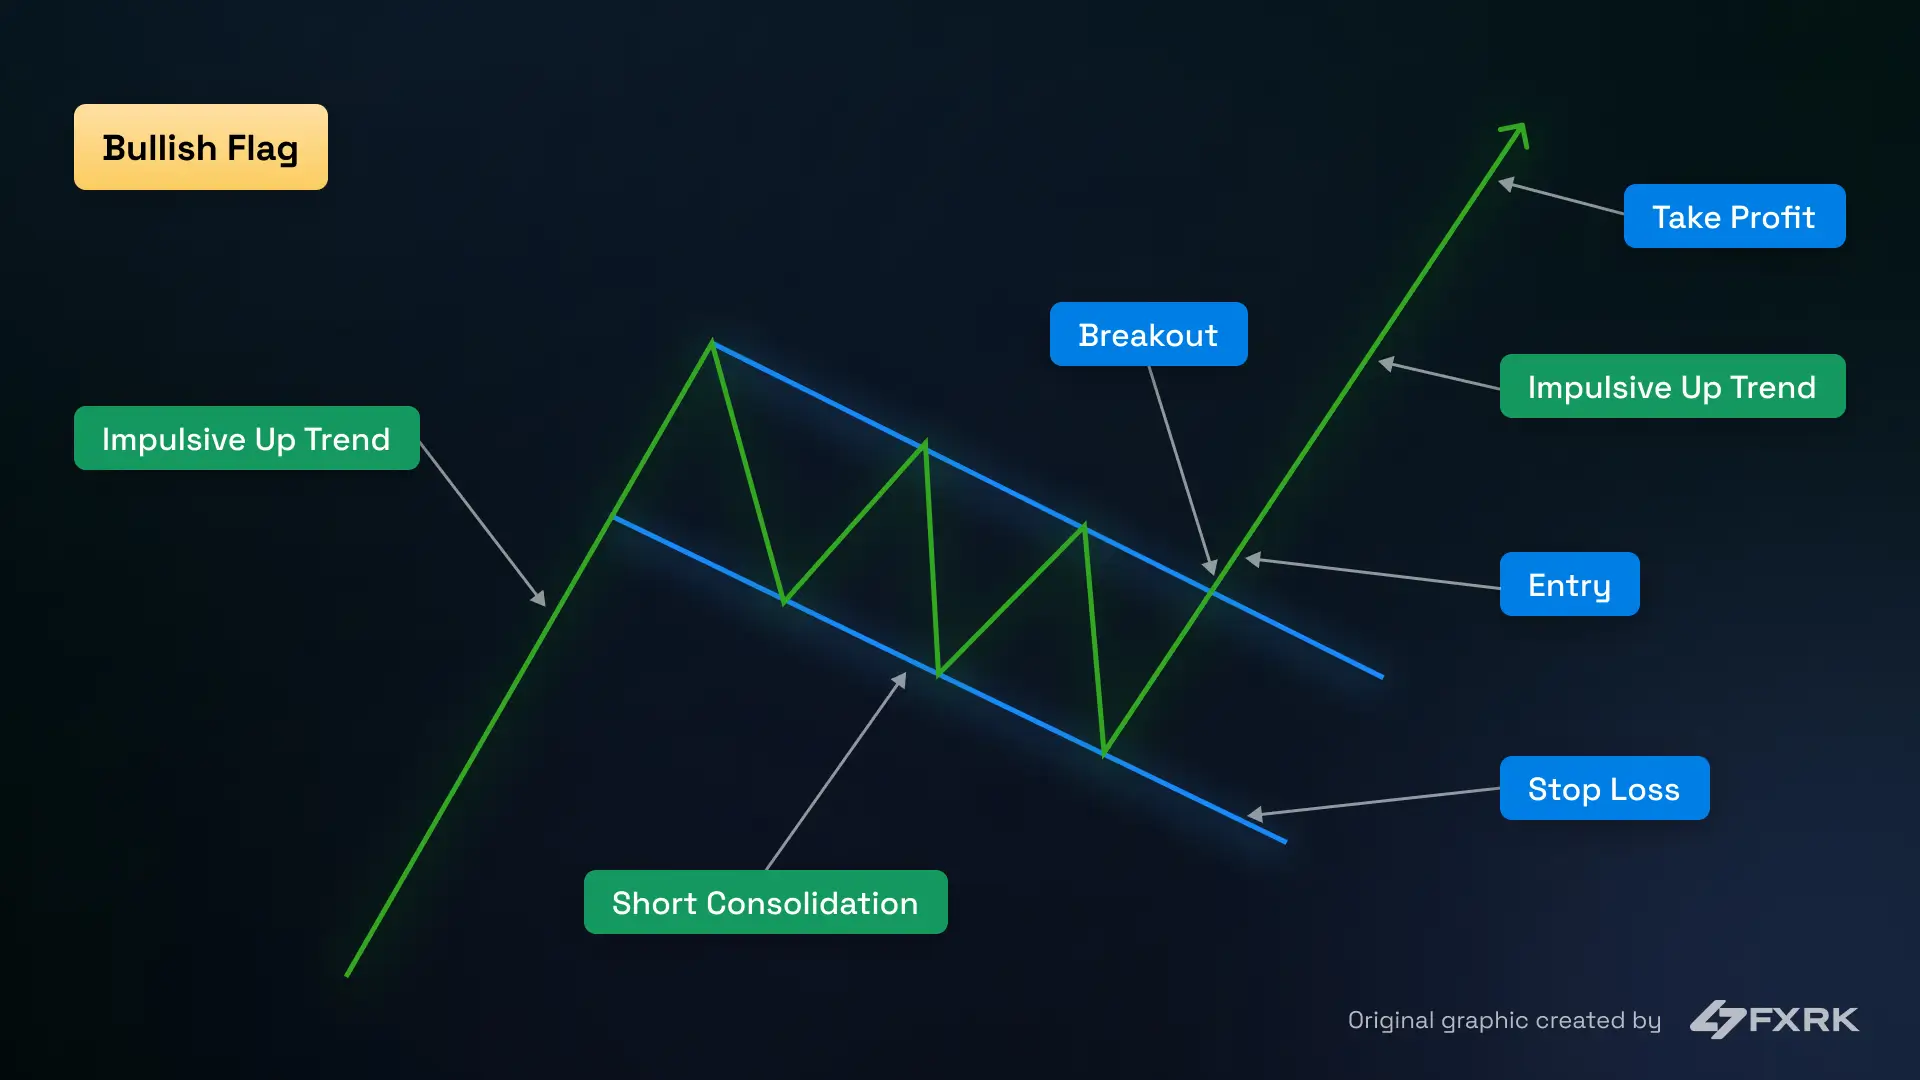
Entry criteria
✅ Enter immediately after the breakout of the flag pattern.
✅ For a more conservative entry, wait for a retest of the flag’s upper boundary.
→ This variation, known as a “bull flag with confirmation,” helps reduce the chance of false breakouts by using the retest as a trigger.
Stop loss
✅ Just below the lower flag boundary or the most recent swing low
Take profit / Risk-Reward
✅ Measure the length of the flagpole and project it upward
✅ Aim for a minimum 2:1 reward-to-risk ratio
Best time frames
✅ 15-minute and 1-hour charts
Market conditions
✅ Works best in strong trending markets with high momentum
📈 Bull flag model with confirmation entry
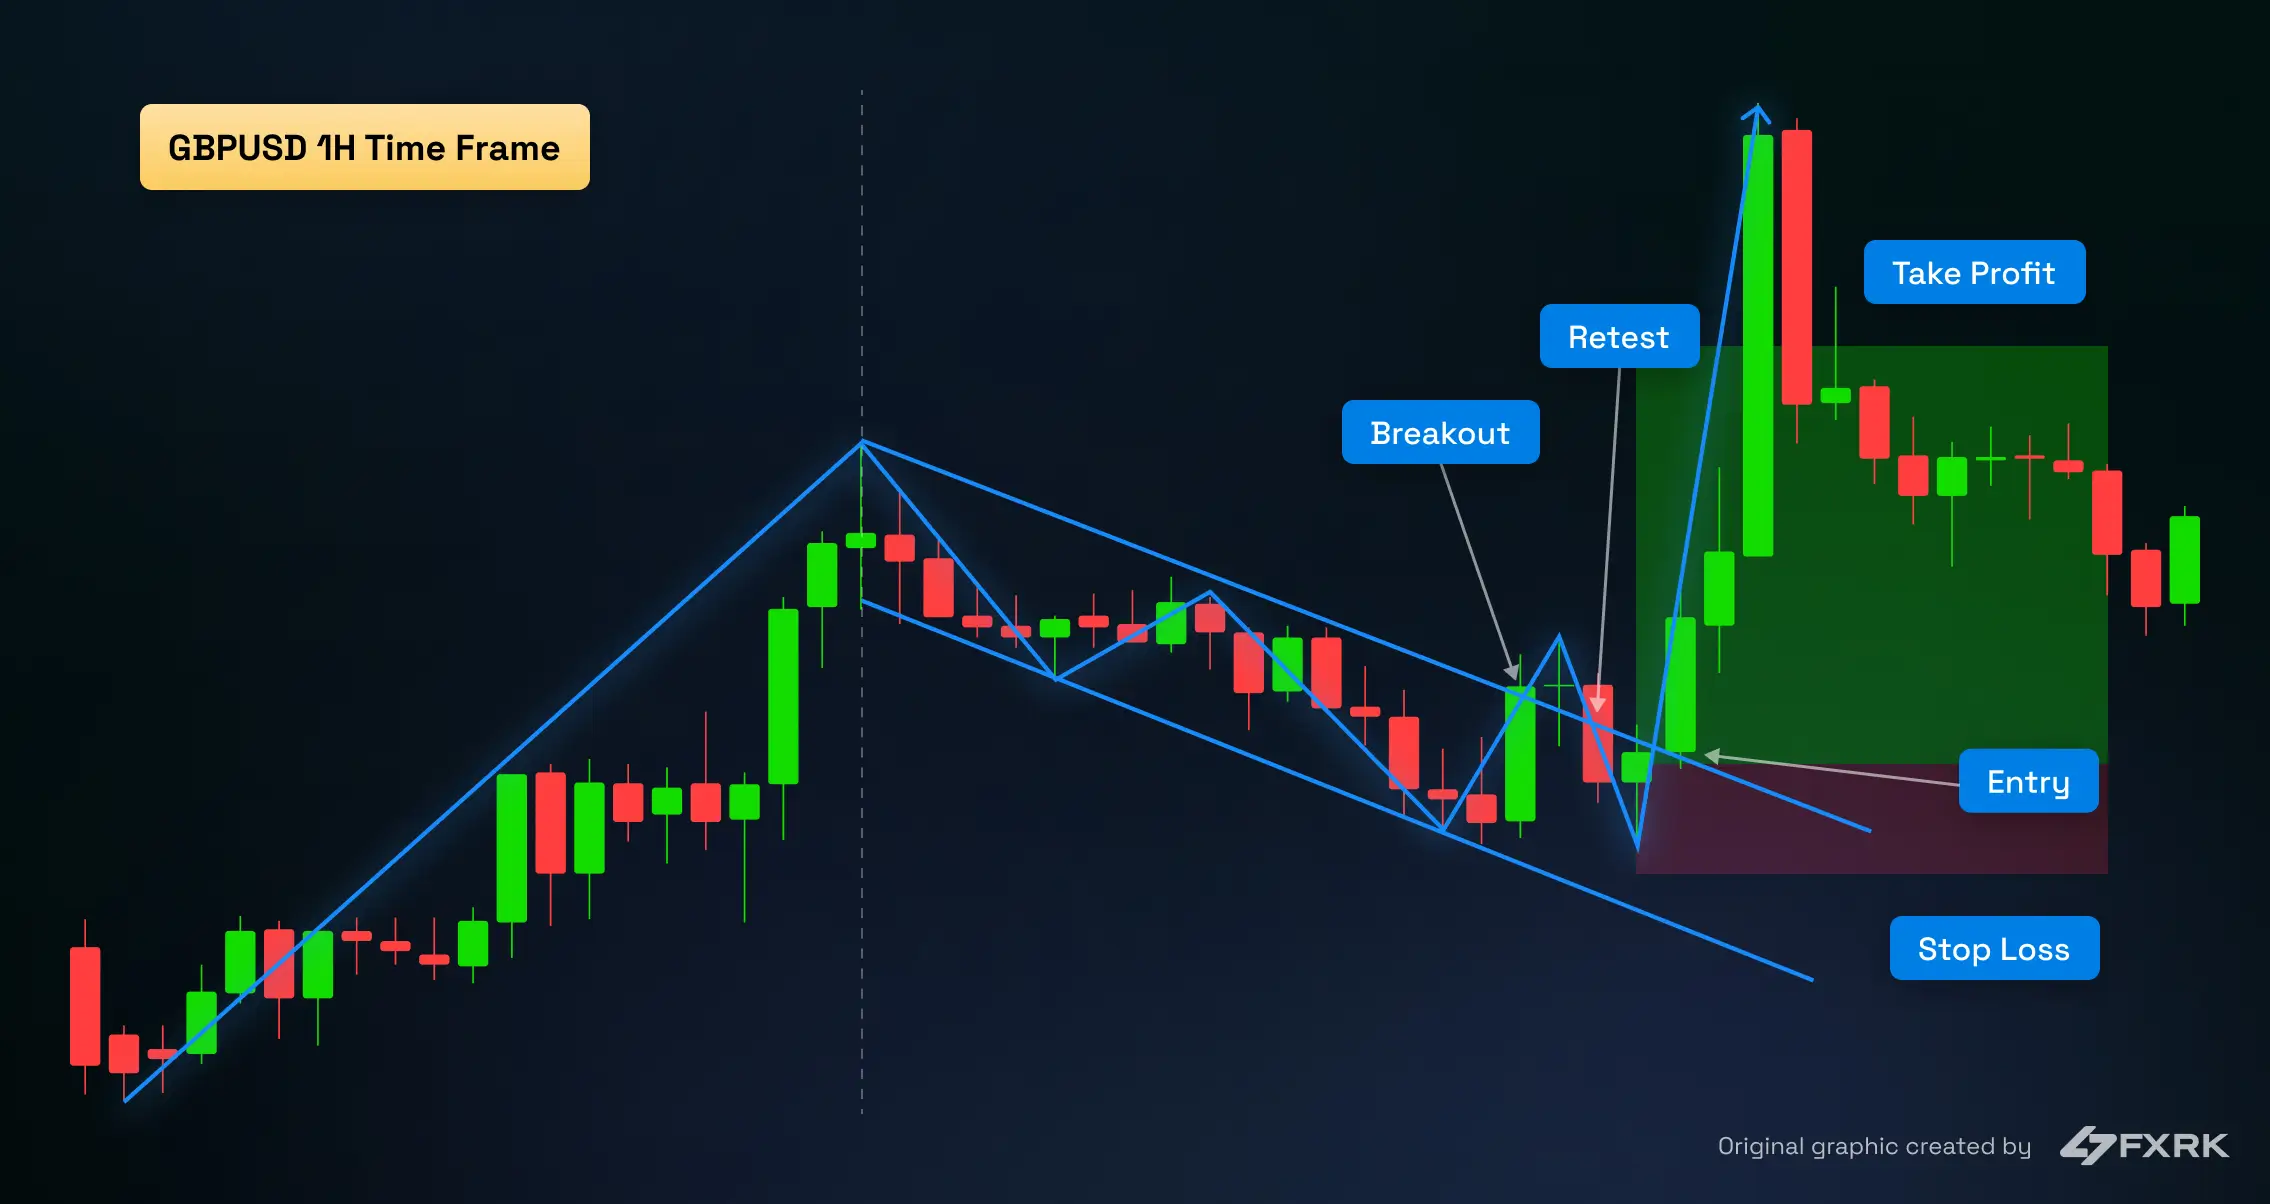
📊 Chart example
GBP/USD on the 1H timeframe shows a textbook bull flag pattern with a clean breakout and confirmation retest before continuation. Notice how price respects the flag structure and offers a high-probability entry aligned with strong momentum.
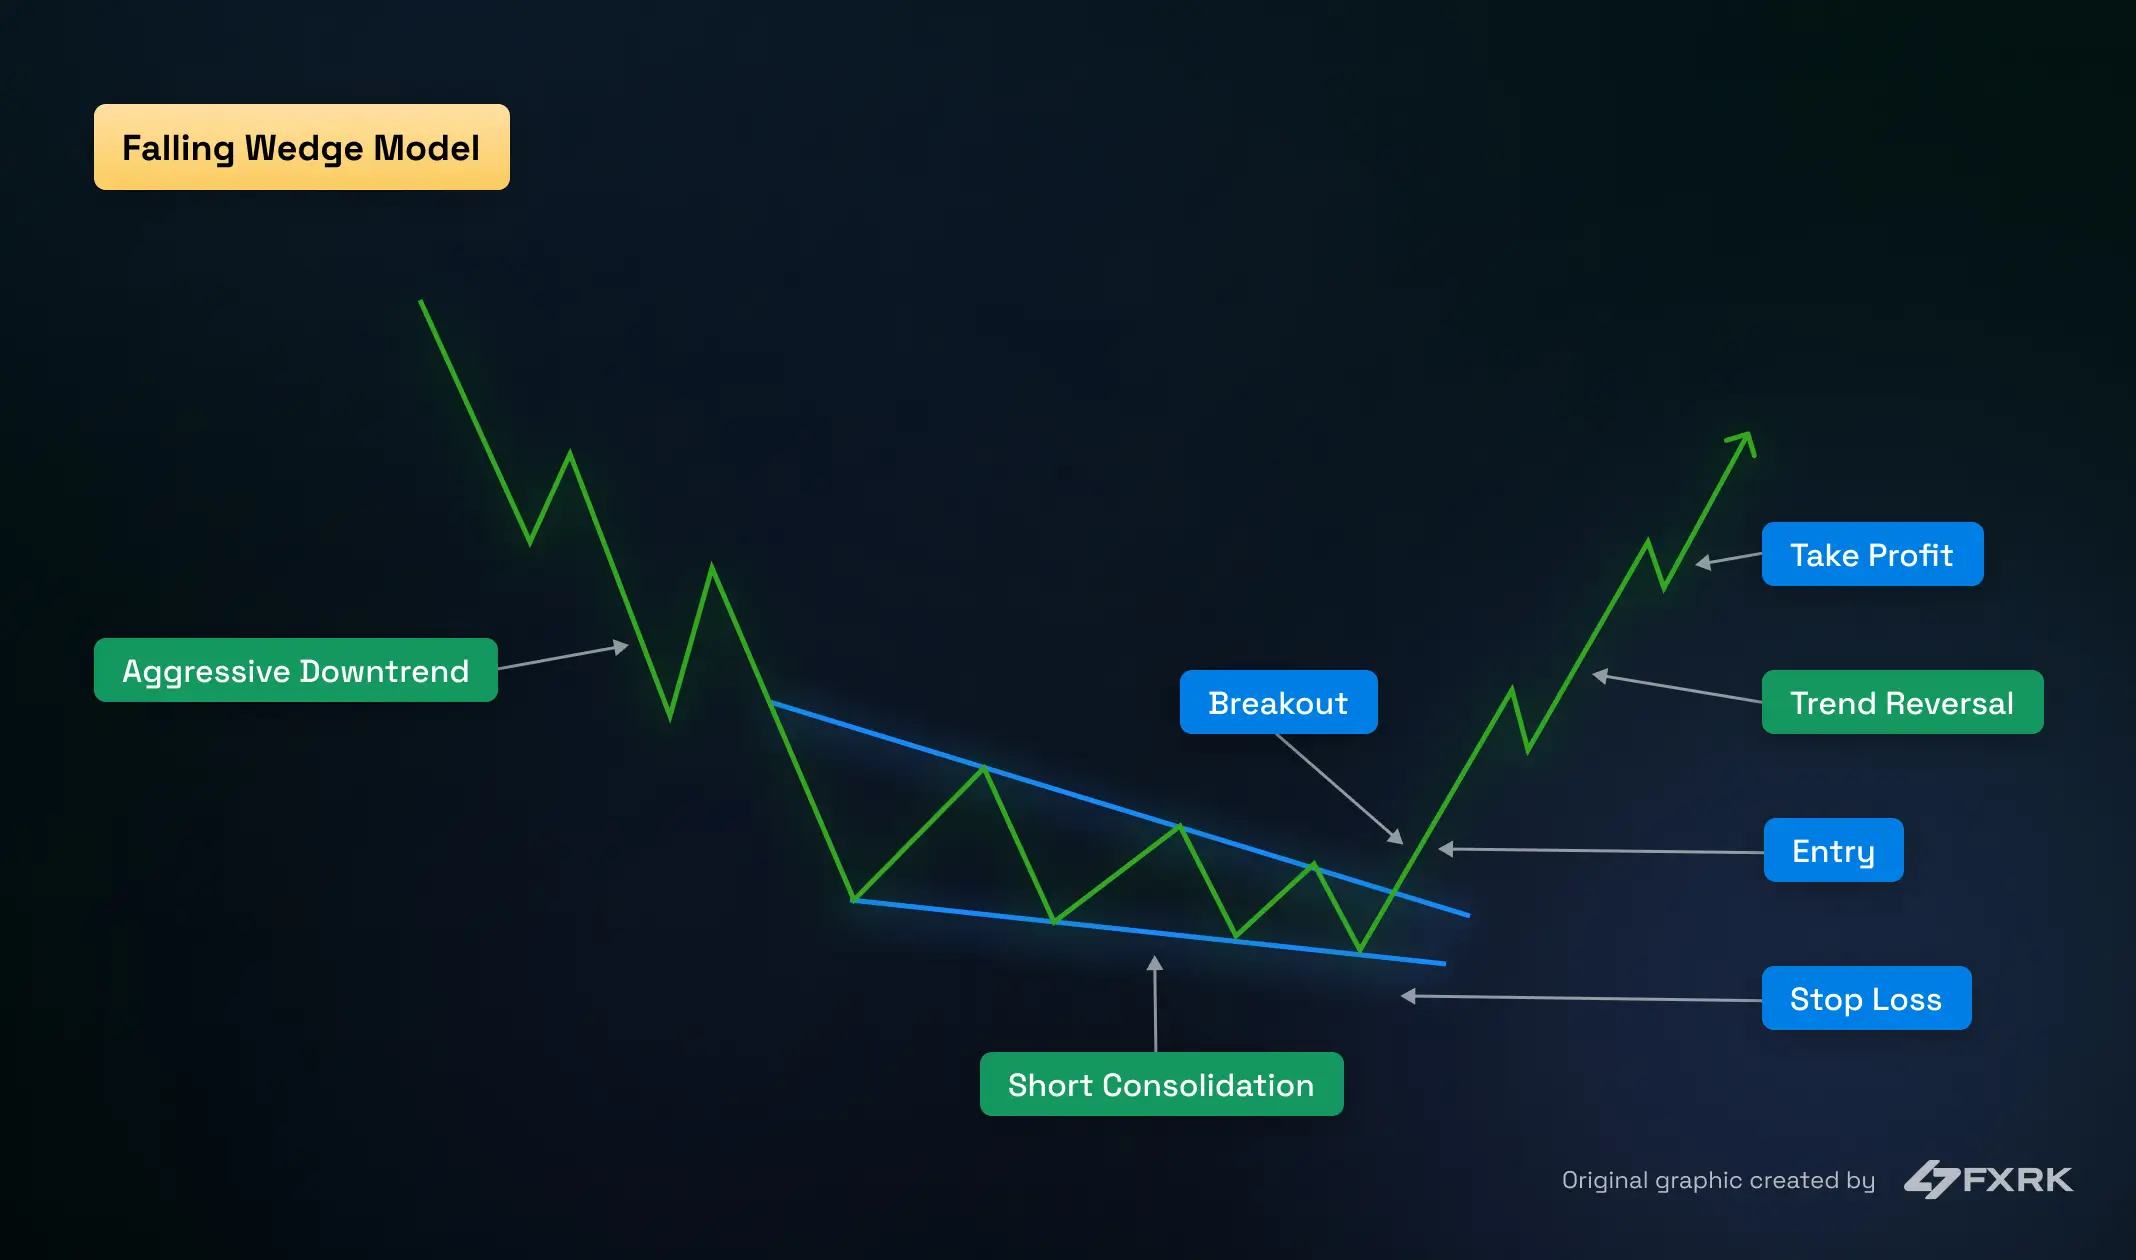
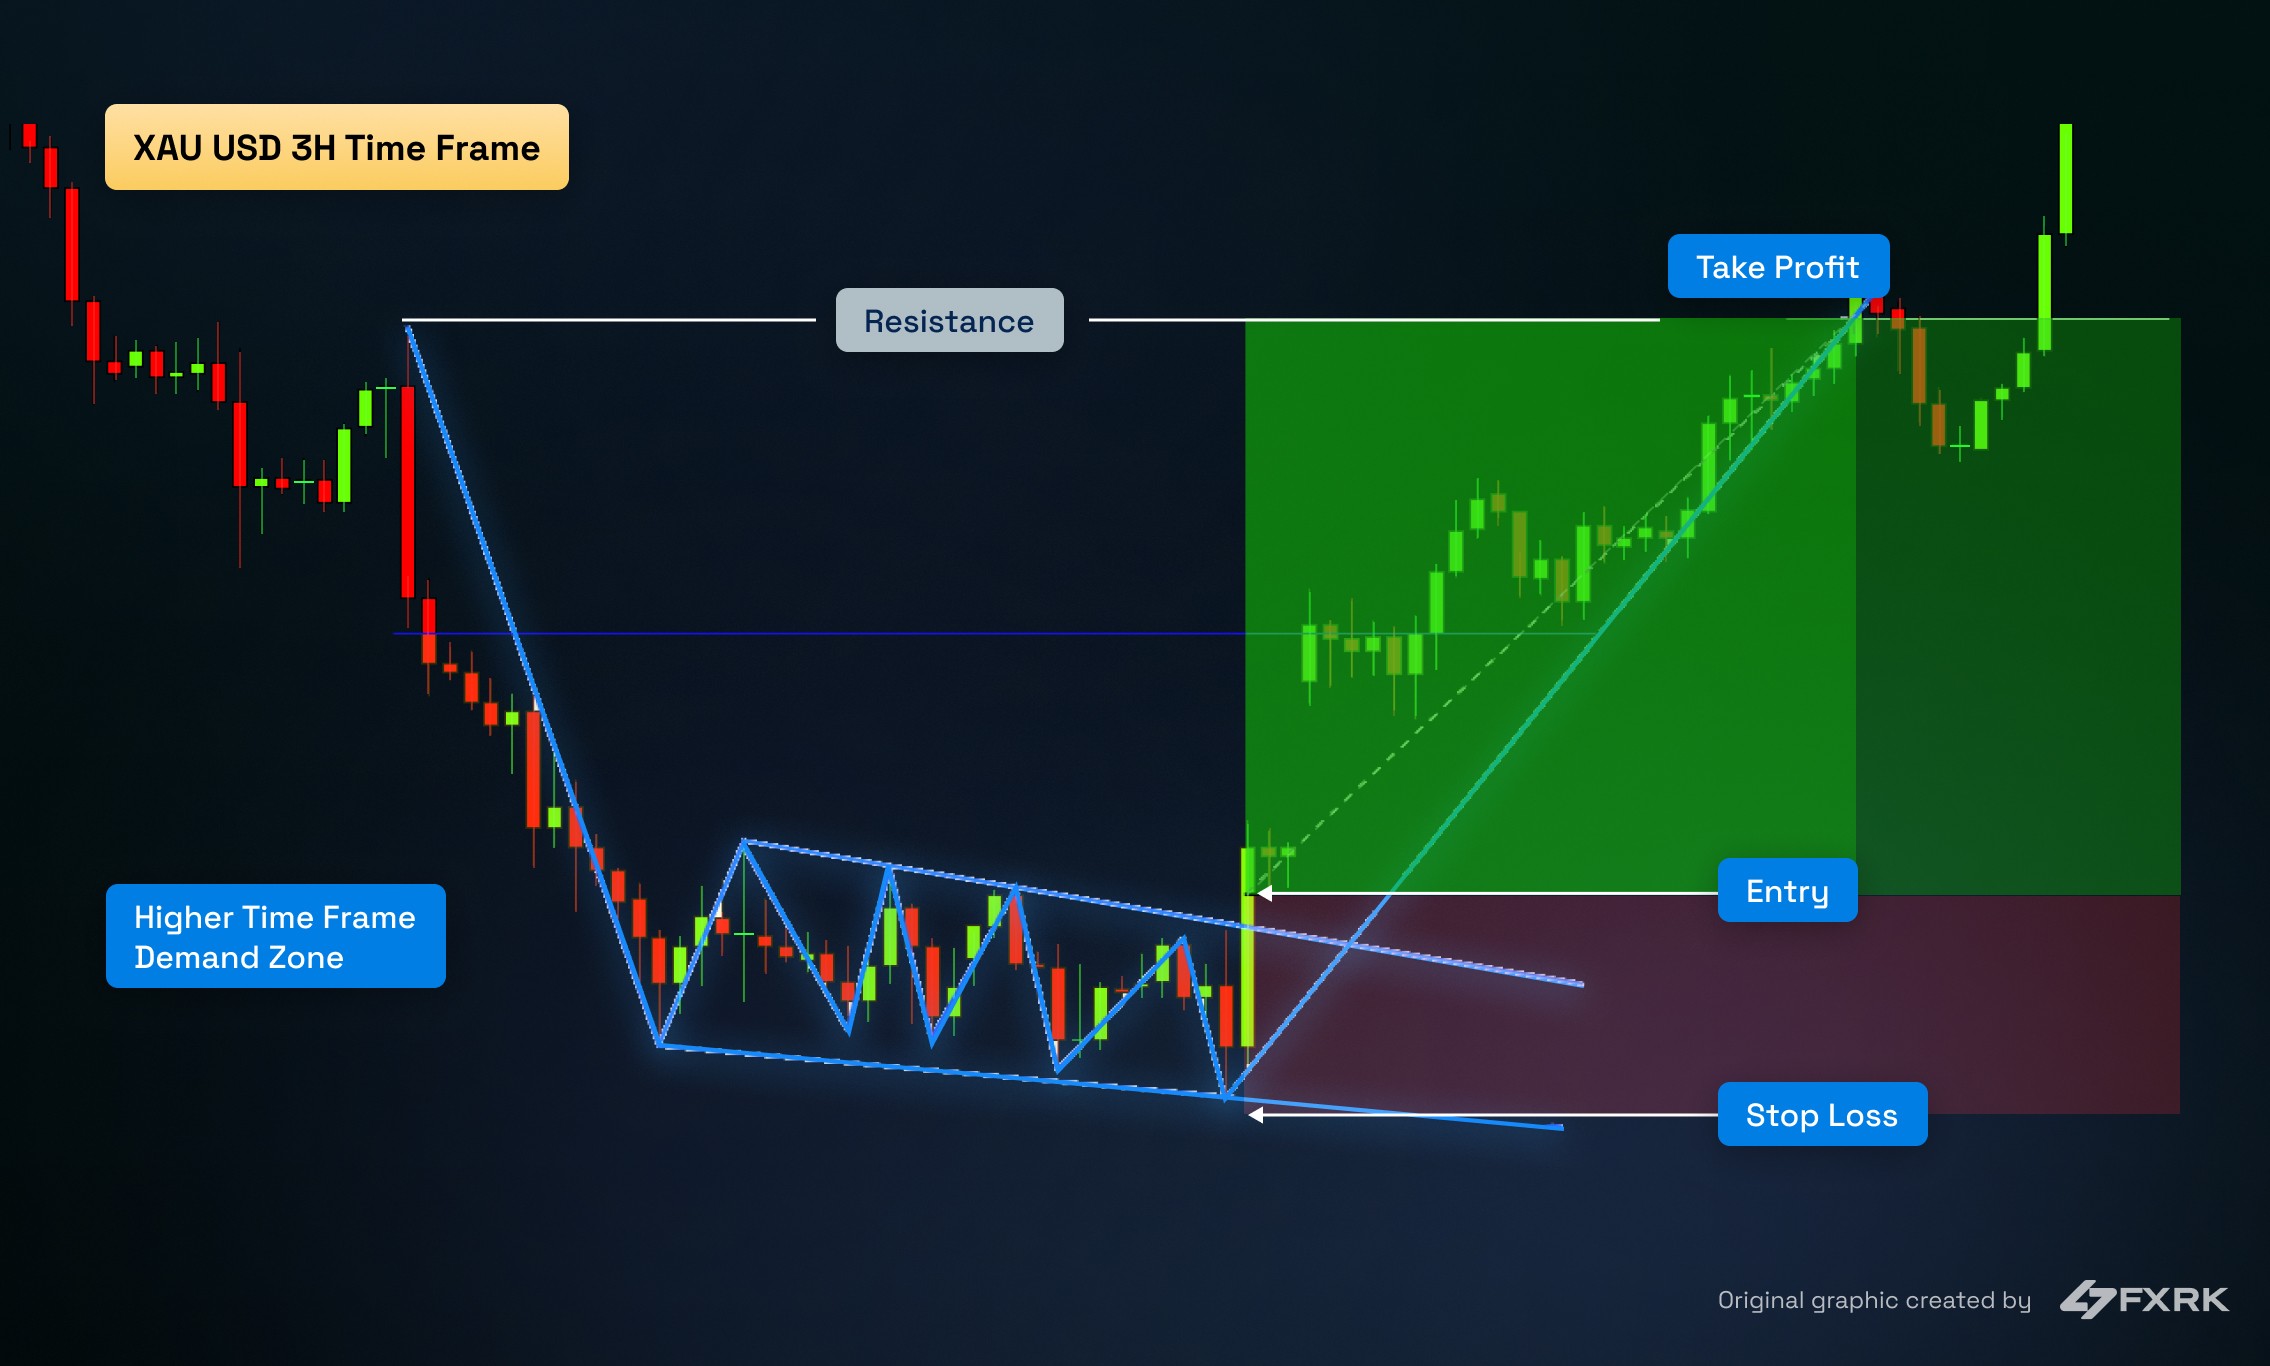
2. Falling Wedge Pattern
The falling wedge is a bullish reversal pattern that appears in a downtrend when price action starts compressing with lower highs and lower lows converging. It reflects weakening seller pressure and potential for trend reversal.
📈 Falling wedge model
Entry criteria
✅ Breakout above the wedge’s upper trendline
✅ Confirmation from a strong bullish engulfing candle, high volume, or RSI divergence
Stop loss
✅ Below the wedge’s lowest point or most recent support
Take profit / Risk-Reward
✅ TP1: Return to the origin of the wedge
✅ TP2: Hold until price reaches a strong resistance level
✅ Minimum 2:1 reward-to-risk ratio
Best time frames
✅ 15-minute, 1-hour, and 4-hour charts
Market conditions
✅ Works best after extended sell-offs or when forming near high time frame demand zones
📊 Chart example
XAU/USD on the 3H timeframe shows a classic falling wedge pattern forming within a higher time frame demand zone. The breakout is followed by a strong bullish continuation, offering a clean entry and solid R/R setup.
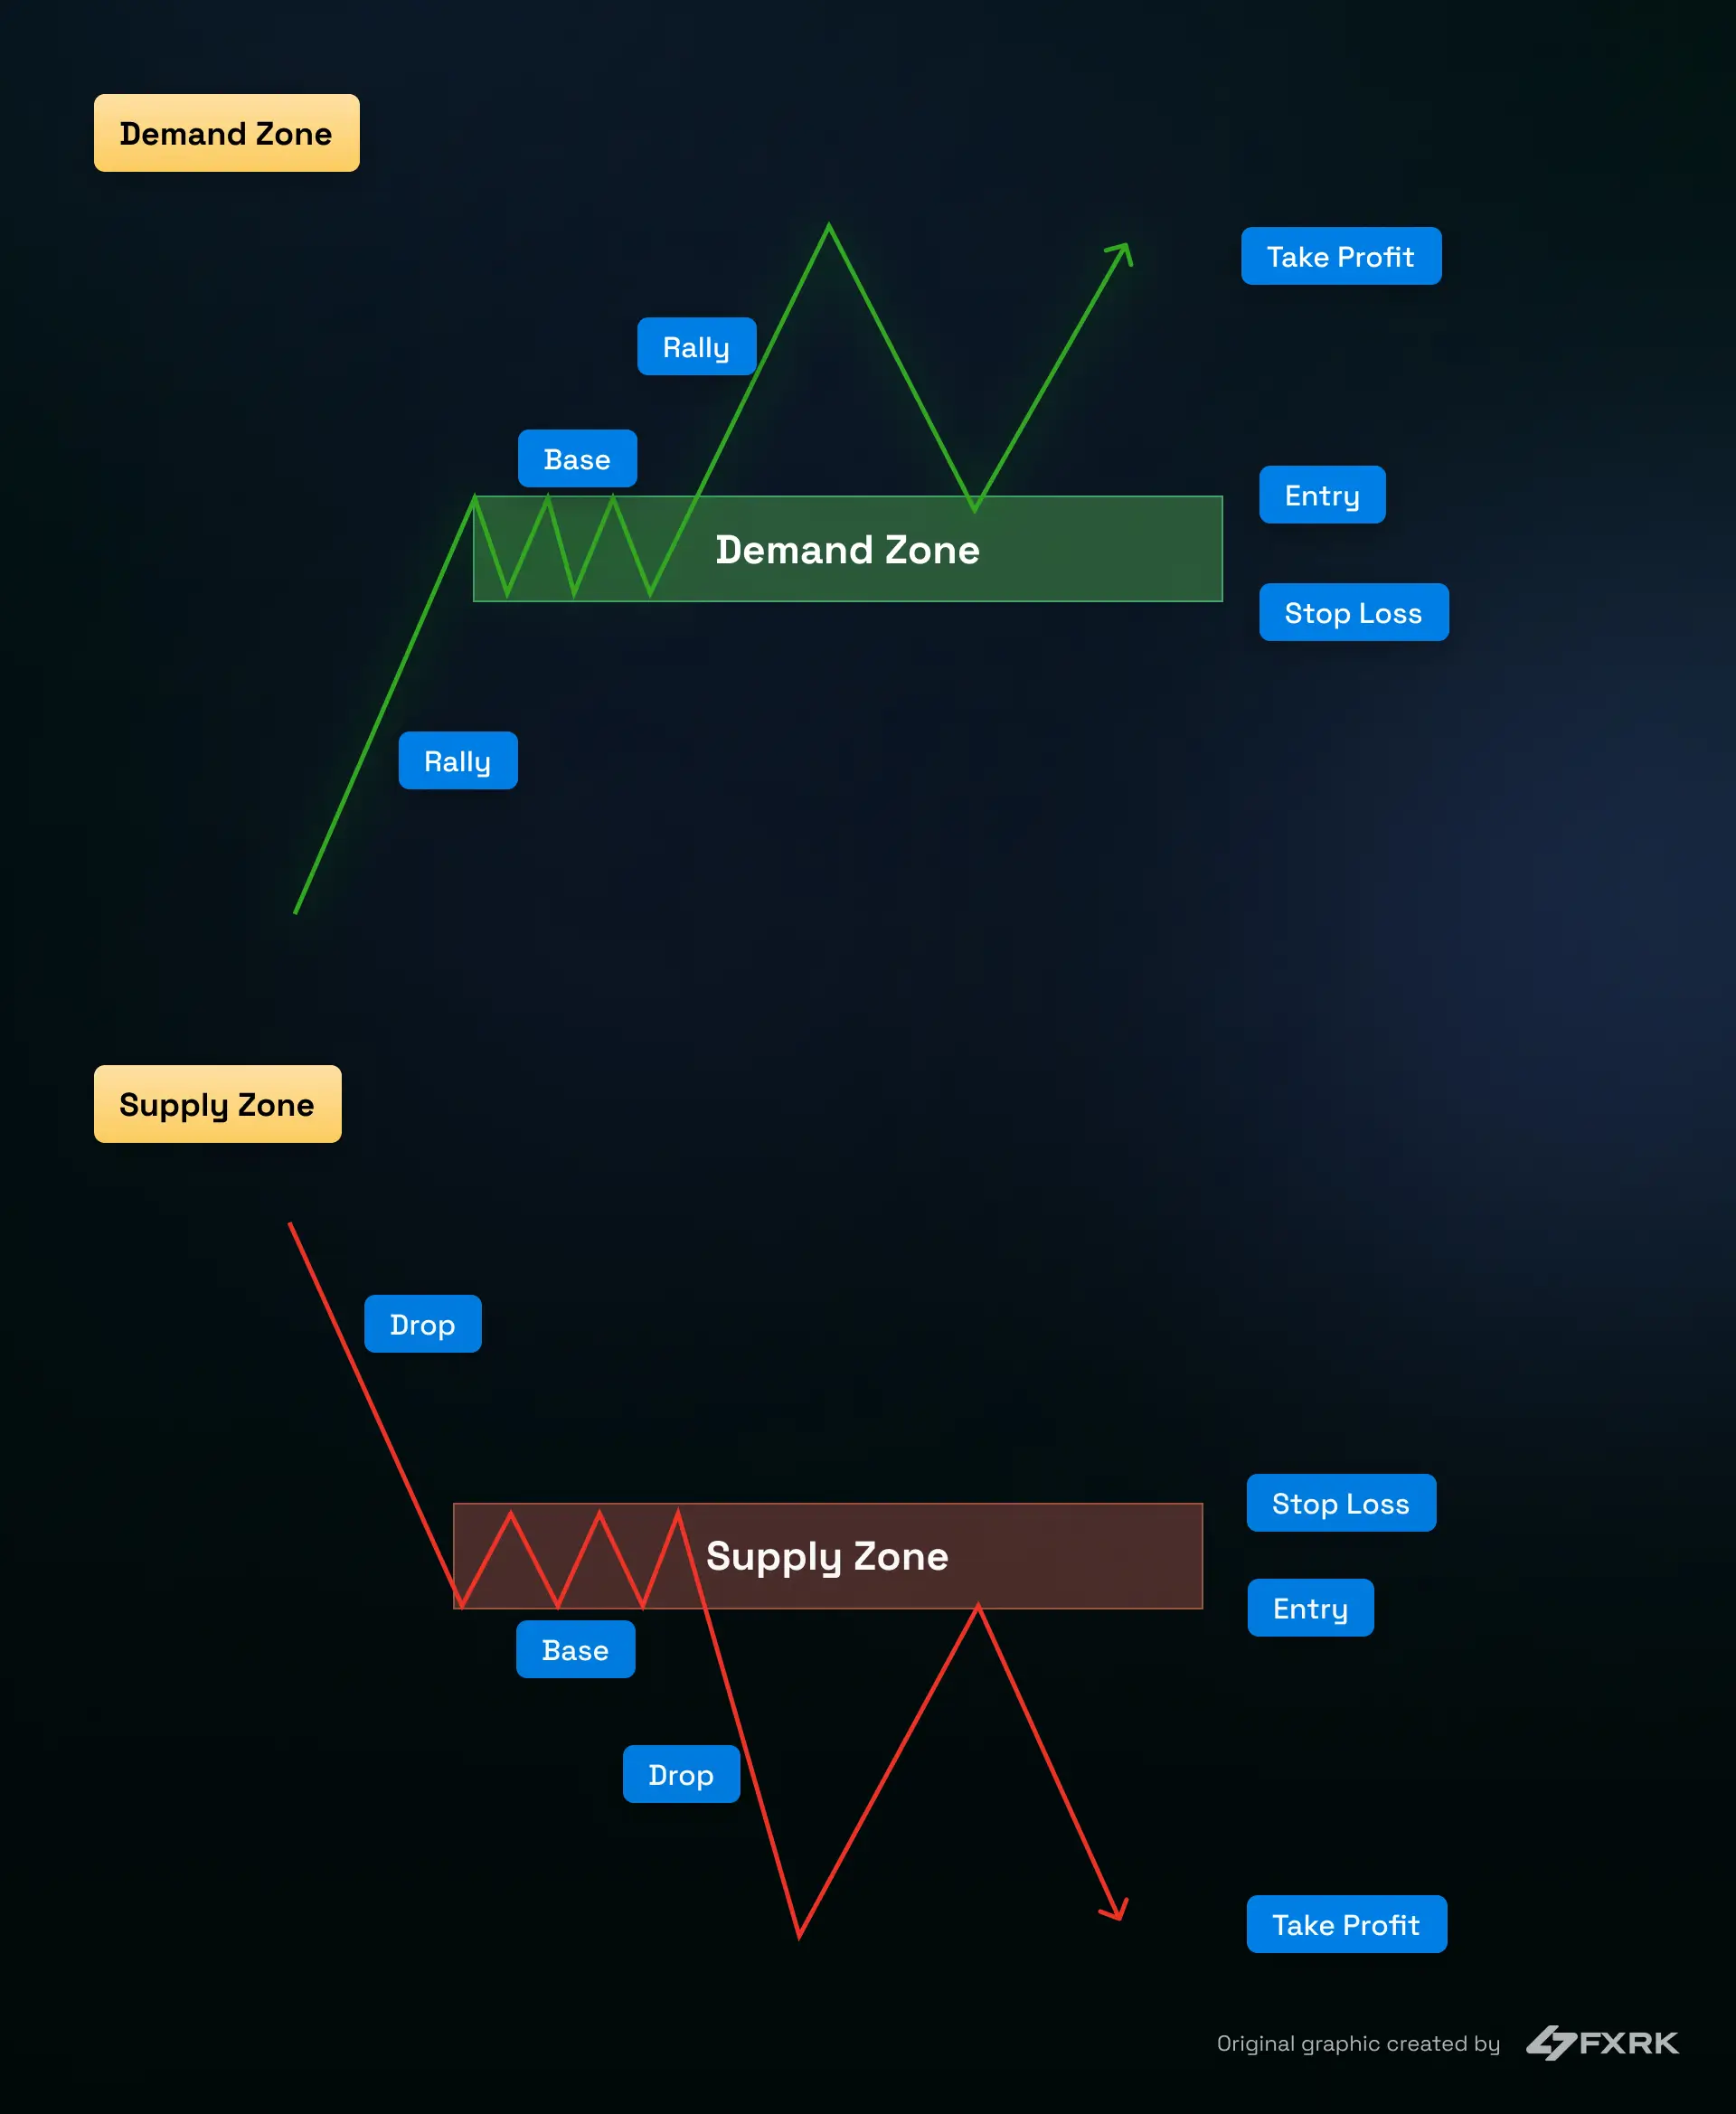
3. Supply & Demand Zones
Supply and demand zones represent institutional footprints on the chart—areas where large buy or sell orders have triggered significant price reactions. These zones are typically identified by structures like rally-base-rally (demand) and drop-base-drop (supply), where the market pauses briefly before making an impulsive move.
When price retraces to these zones, it often does so to collect remaining institutional orders, then continues in the original direction, offering high-probability entry opportunities.
📈 Supply and demand models
Entry criteria
✅ Identify fresh demand/supply zones with sharp impulsive move
✅ Wait for price to return and show rejection (e.g., wick, engulfing candle)
Stop loss
✅ Below demand zone (long) or above supply zone (short)
Take profit / Risk-Reward
✅ Target the next significant high or low
✅ Aim for a minimum 2:1 reward-to-risk ratio
Best time frames
✅ Zone identification: 4H or 1H
✅ Entry confirmation: 15-minute or 5-minute charts
Market conditions
✅ Works best in clean, trending markets without excessive noise or consolidation
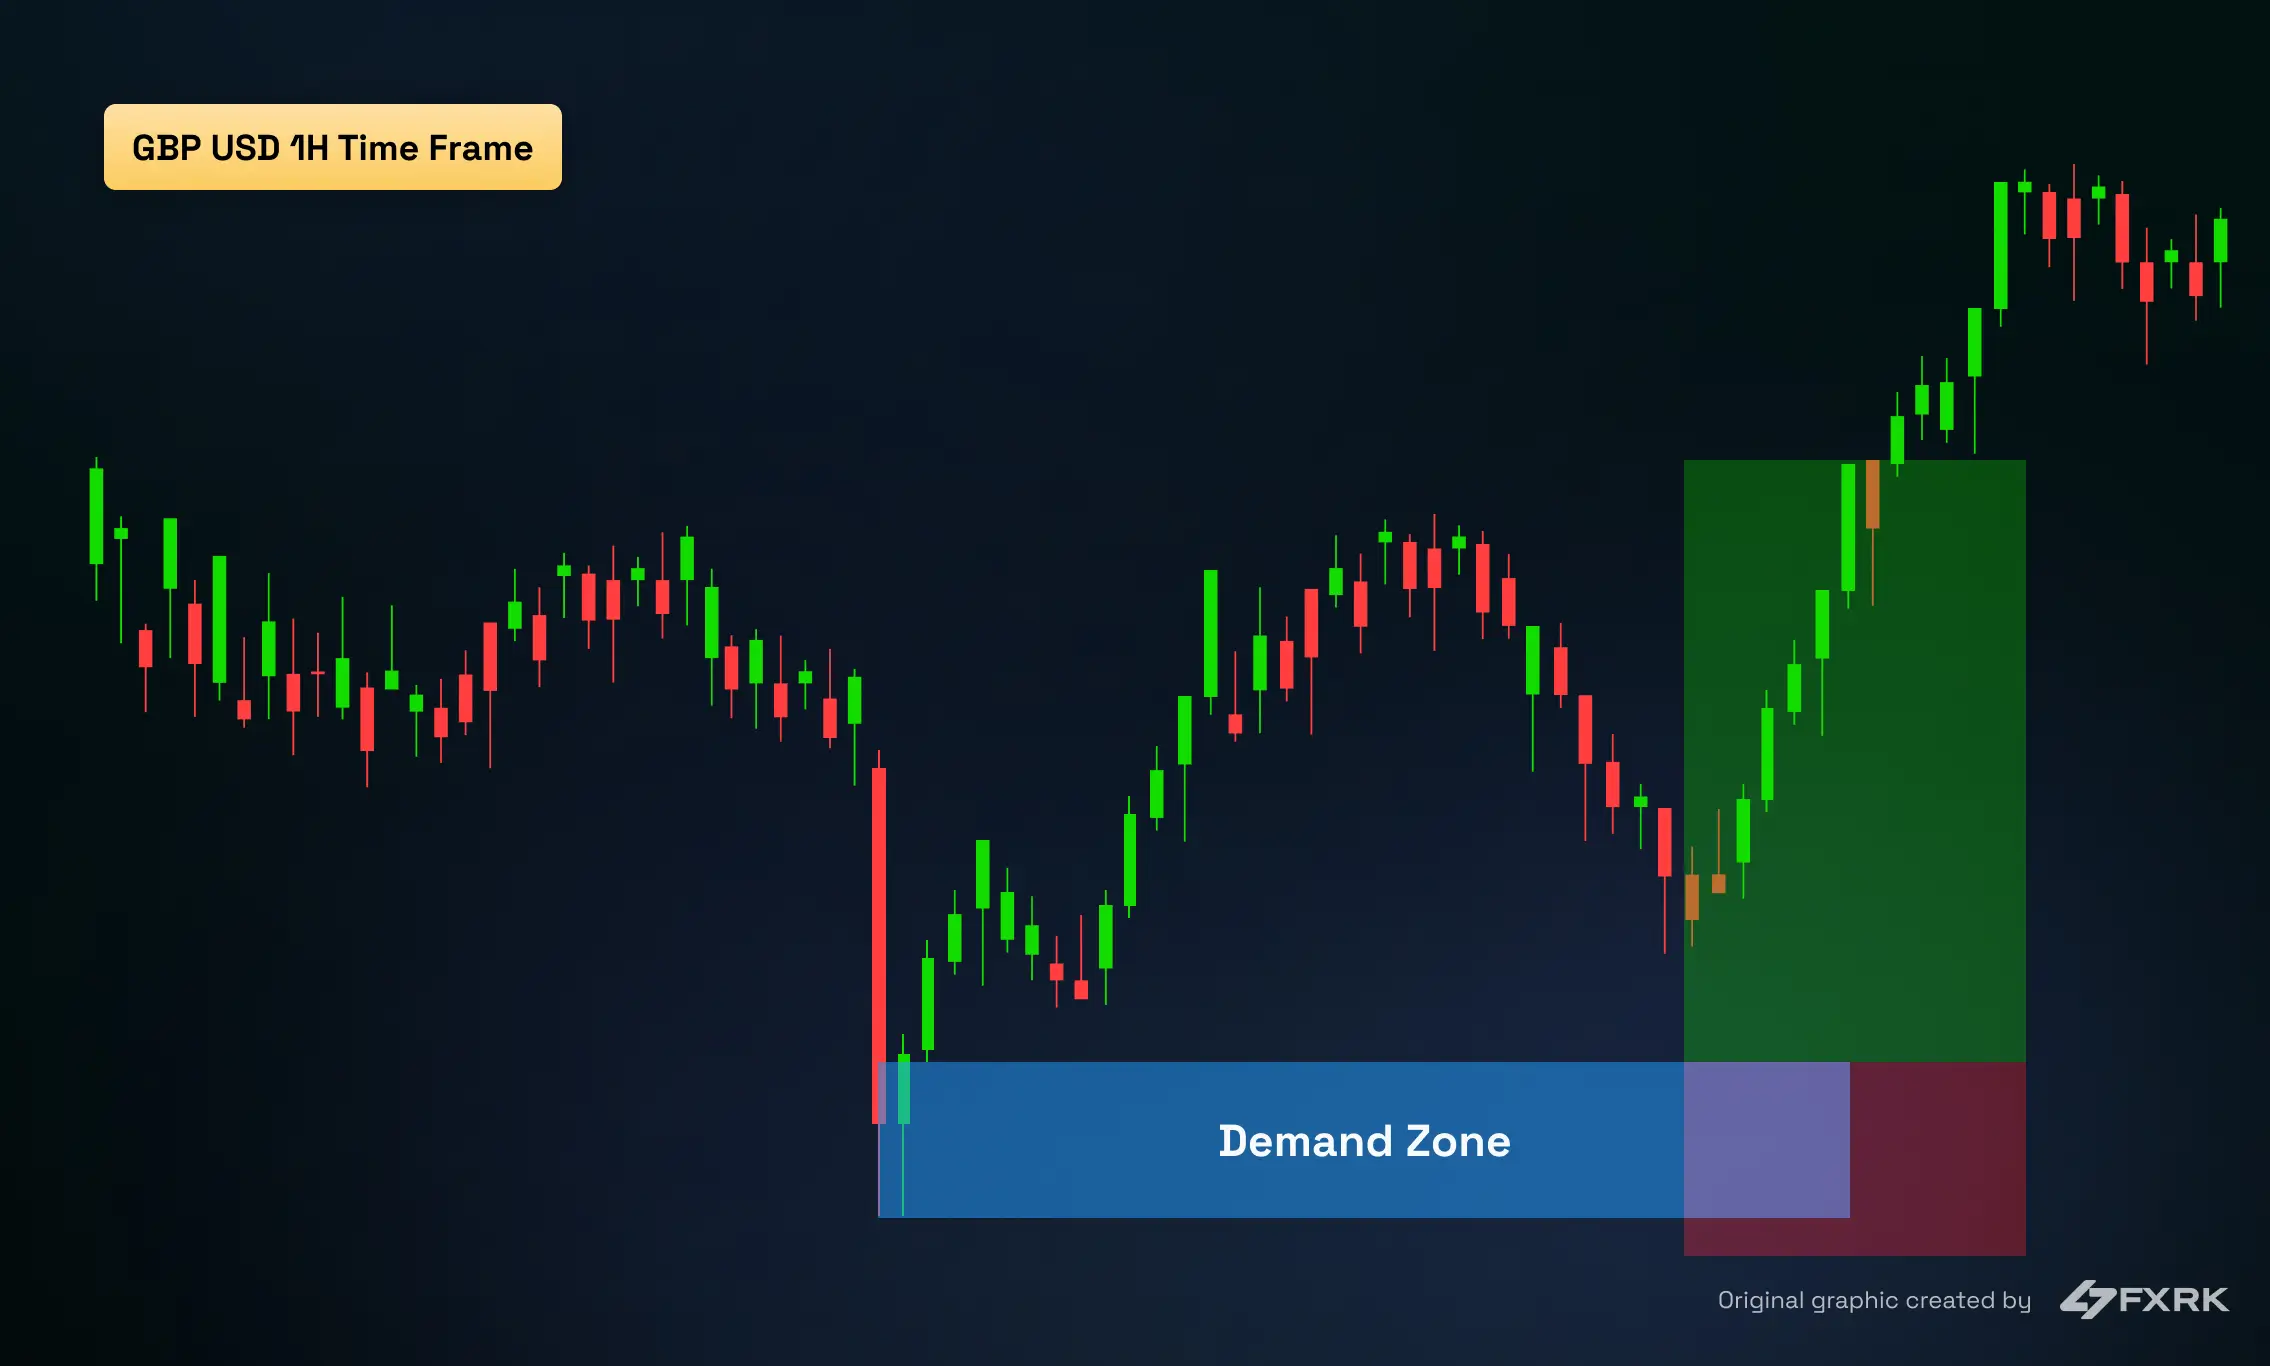
📊 Chart example
GBP/USD 1H chart showing a demand zone bounce. Price respected the zone and moved upward toward the recent high, providing a clear entry setup with favorable risk-to-reward ratio.
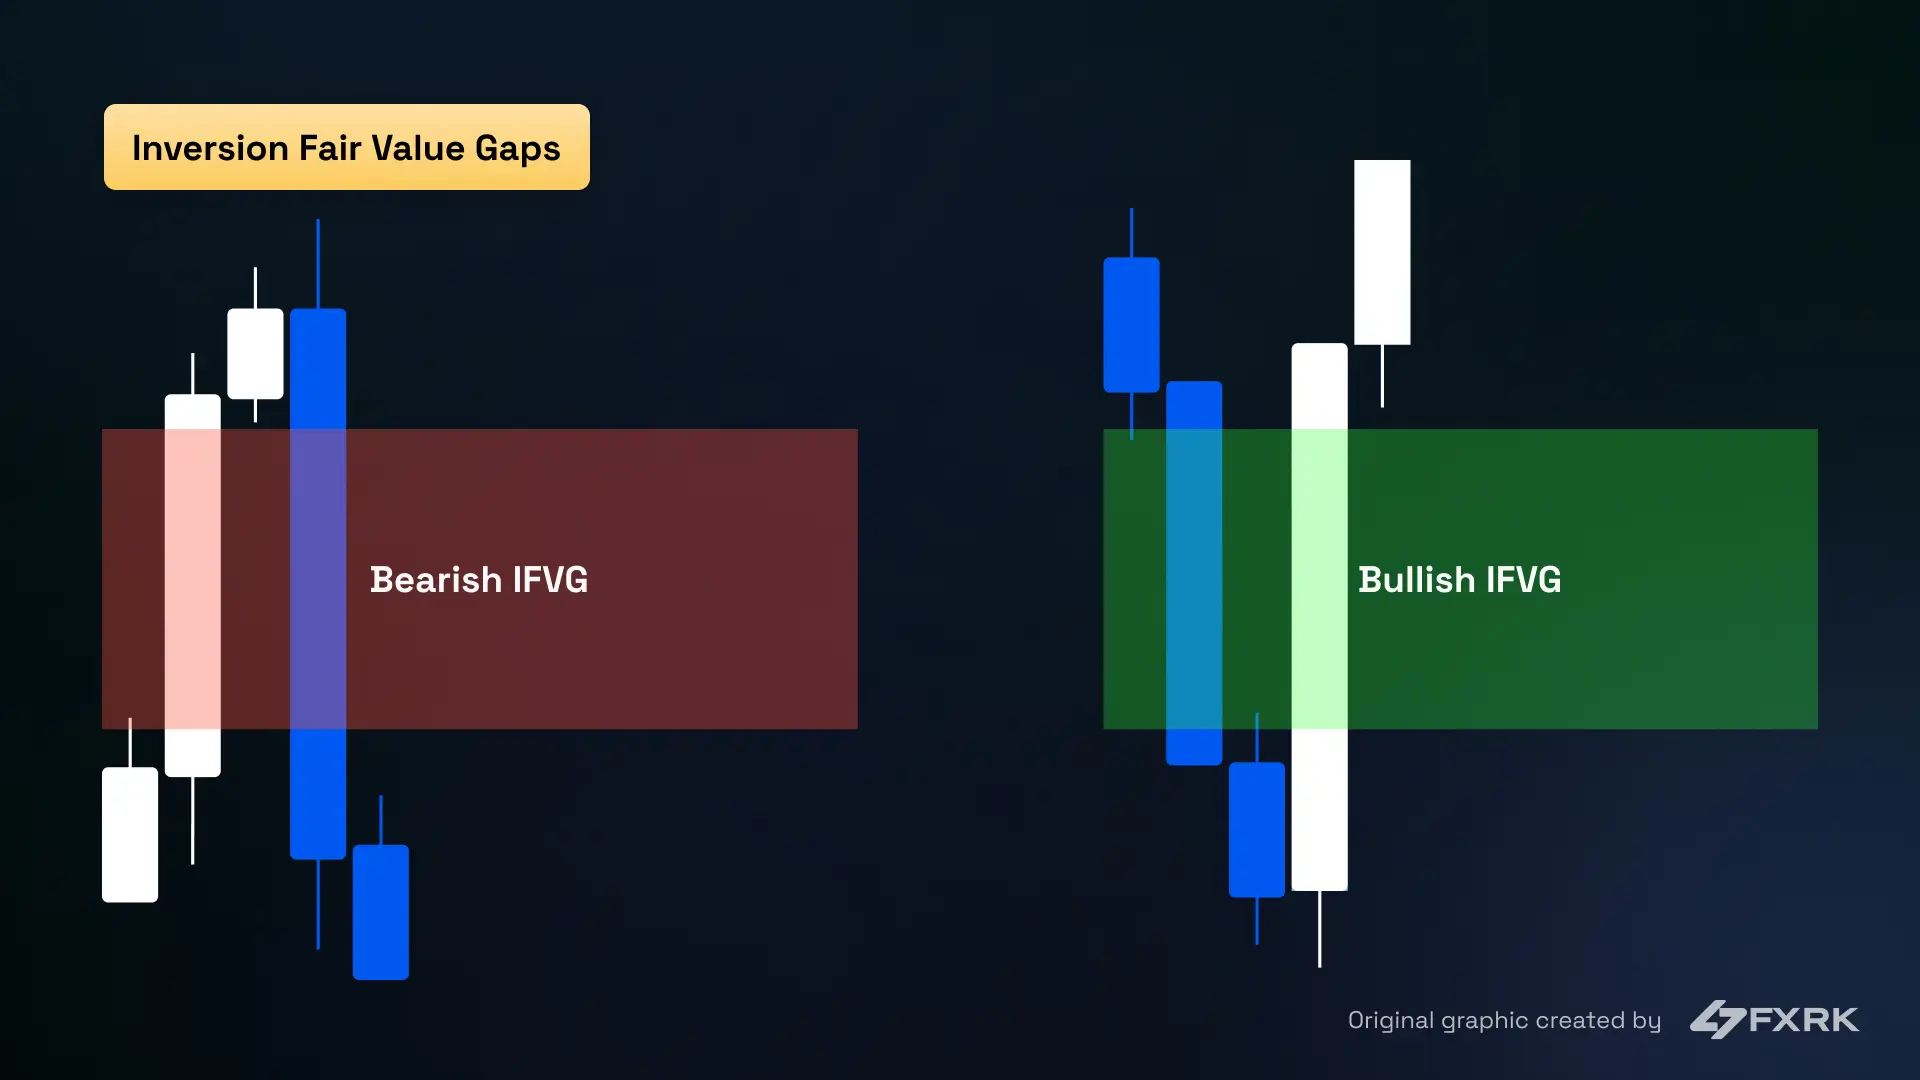
4. Inversion Fair Value Gaps (IFVGs)
Inversion Fair Value Gaps (IFVGs) are Fair Value Gaps that fail and flip direction. When price breaks through a gap and closes past it, it creates a new imbalance the other way. That flipped gap then acts as a point of interest, indicating a clear entry in line with the trend.
📈 Inversion fair value gaps models
Entry criteria
✅ Identify an IFVG following a strong impulsive move (often after a liquidity sweep)
✅ Wait for price to return into the gap
Stop loss
✅ Just beyond the far edge of the gap
Take profit / Risk-Reward
✅ Target the opposite swing high or low (depending on direction)
✅ Maintain a minimum reward-to-risk ratio of 2:1
Best time frames
✅ 5-minute and 15-minute charts
Market conditions:
✅ IFVGs are highly effective during the New York session, especially after price sweeps a key high or low.
✅ This setup is often aligned with the Wyckoff cycle: accumulation, manipulation, and distribution, offering precise timing and strong follow-through.
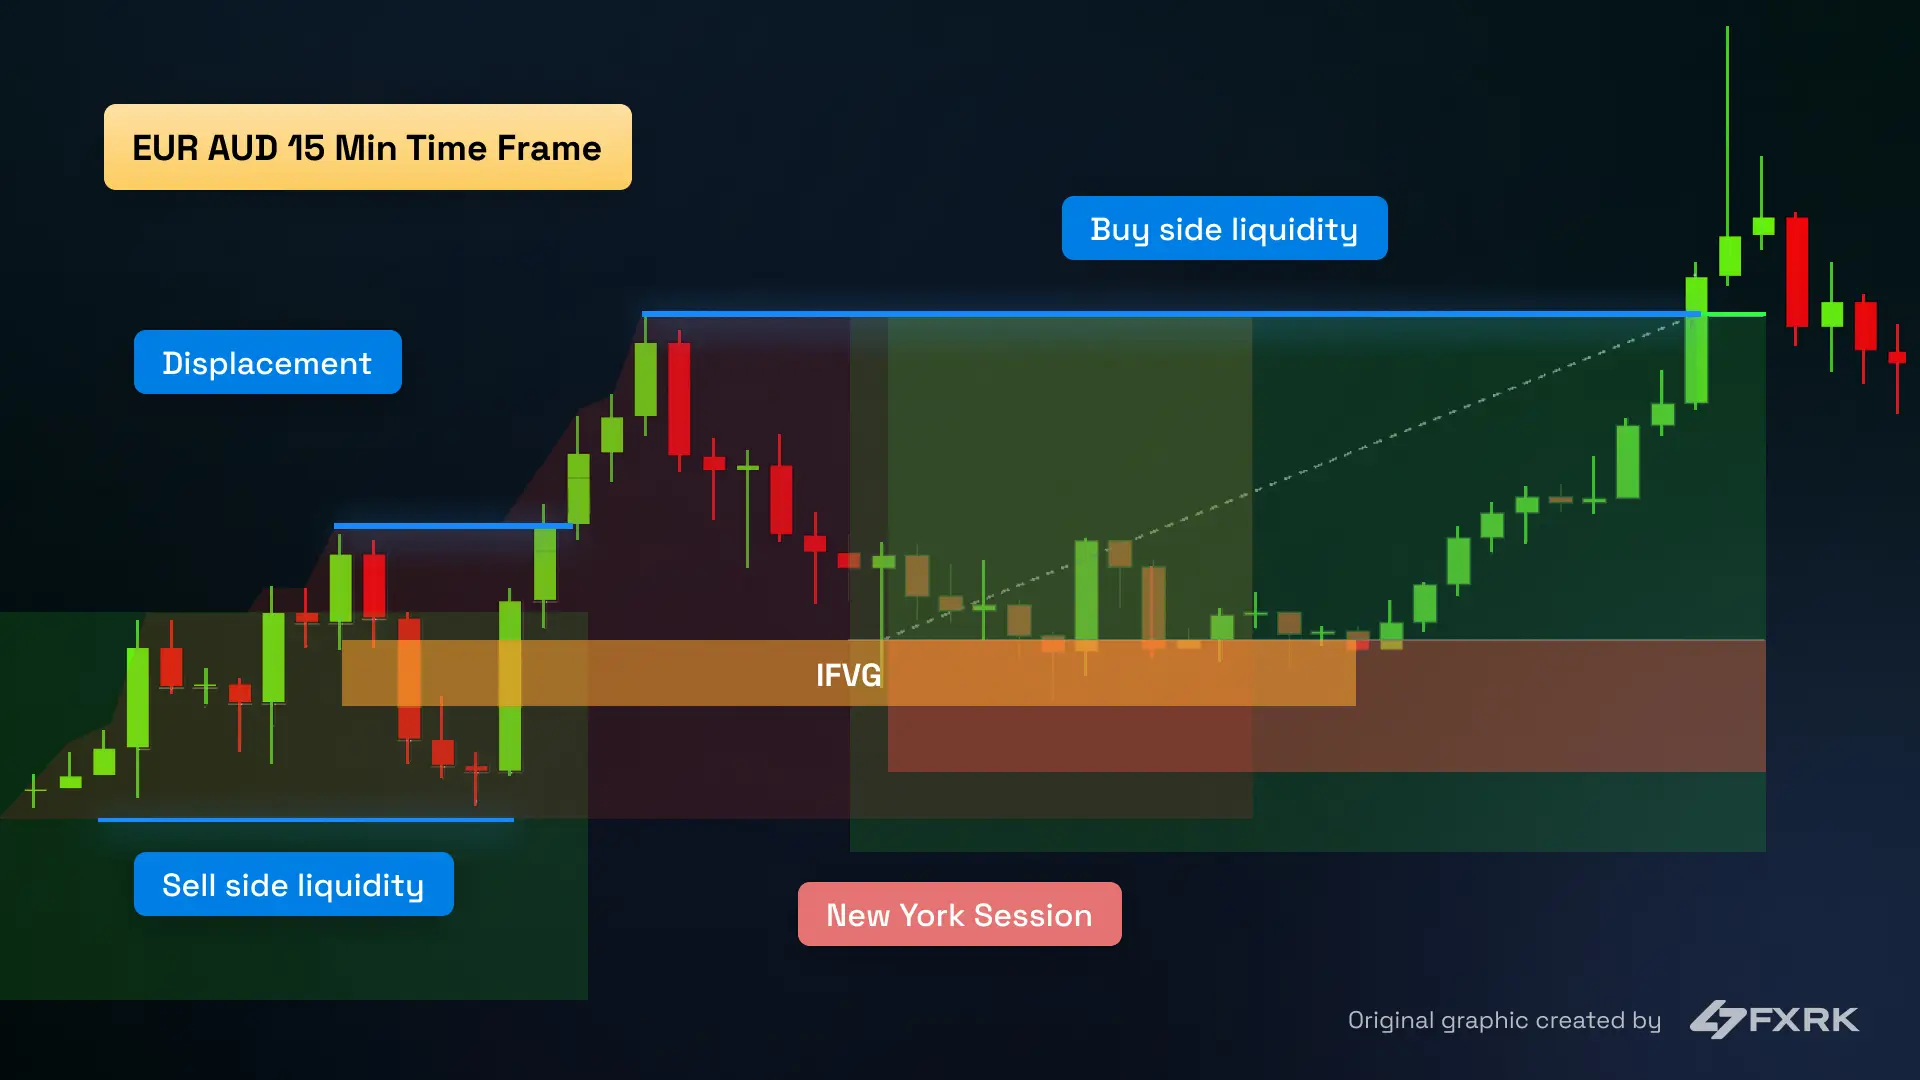
📊 Chart example 1
After a sweep of the previous low, price forms a bullish IFVG and creates a higher high (buy-side liquidity). During the New York session, price retraces into the gap and rejects it cleanly providing a precise entry with favorable R/R, targeting the next liquidity zone.
📊 Chart example 2
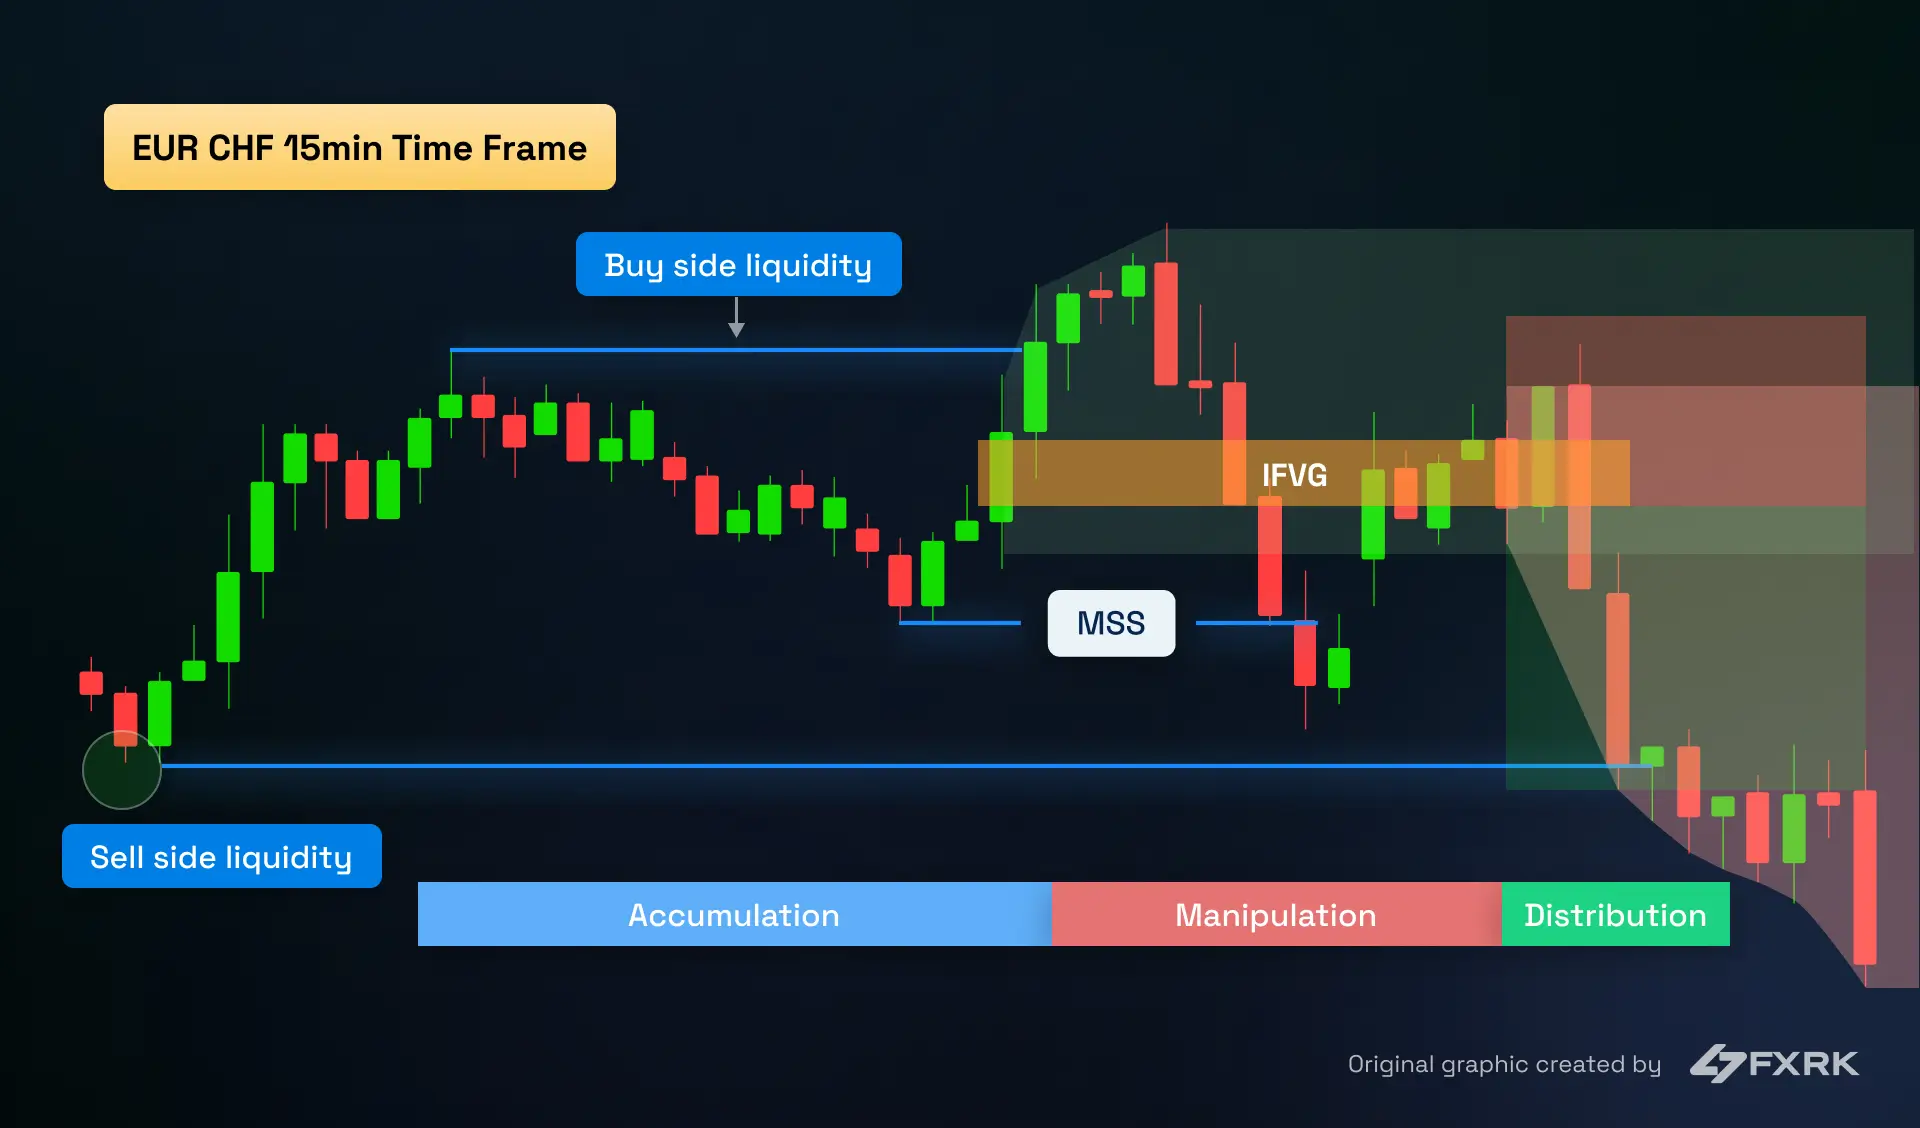
This trade represents a clear example of the Wyckoff market cycle: accumulation, manipulation, and distribution.
Asia session forms a range (accumulation). At the London open, price sweeps the buy-side liquidity (manipulation) and reverses sharply, forming an IFVG. During the New York session (distribution), price re-tests the gap, providing an excellent entry aligned with smart money behavior and session timing.
5. Turtle Soup
The Turtle Soup strategy, introduced in the 1990s, is designed to capitalize on false breakouts beyond key highs or lows. The strategy works well around liquidity zones like days highs/lows. It's widely used in intraday trading for its reliability and strong risk-to-reward potential.
📈 Turtle soup model

Entry criteria
✅ Price breaks a previous high or low, then closes back inside the range
✅ Enter on confirmation: a strong engulfing candle paired with a market structure shift (MSS) on a lower time frame
Stop loss
✅ It should be just beyond the breakout wick (above the high or below the low)
Take profit / Risk-Reward
✅ First target: next support/resistance level
✅ Optional: aim for external key structures for greater R/R
✅ Minimum recommended: 3 to 1 reward-to-risk ratio
Best time frames
✅ 1H, 2H, and 4H
✅ Works best with confirmation from lower time frames such as 5M or 15M
Market conditions
✅ Performs well in trending, efficient markets with strong retests especially Forex pairs
✅ Effective during any trading session when price is near obvious liquidity levels
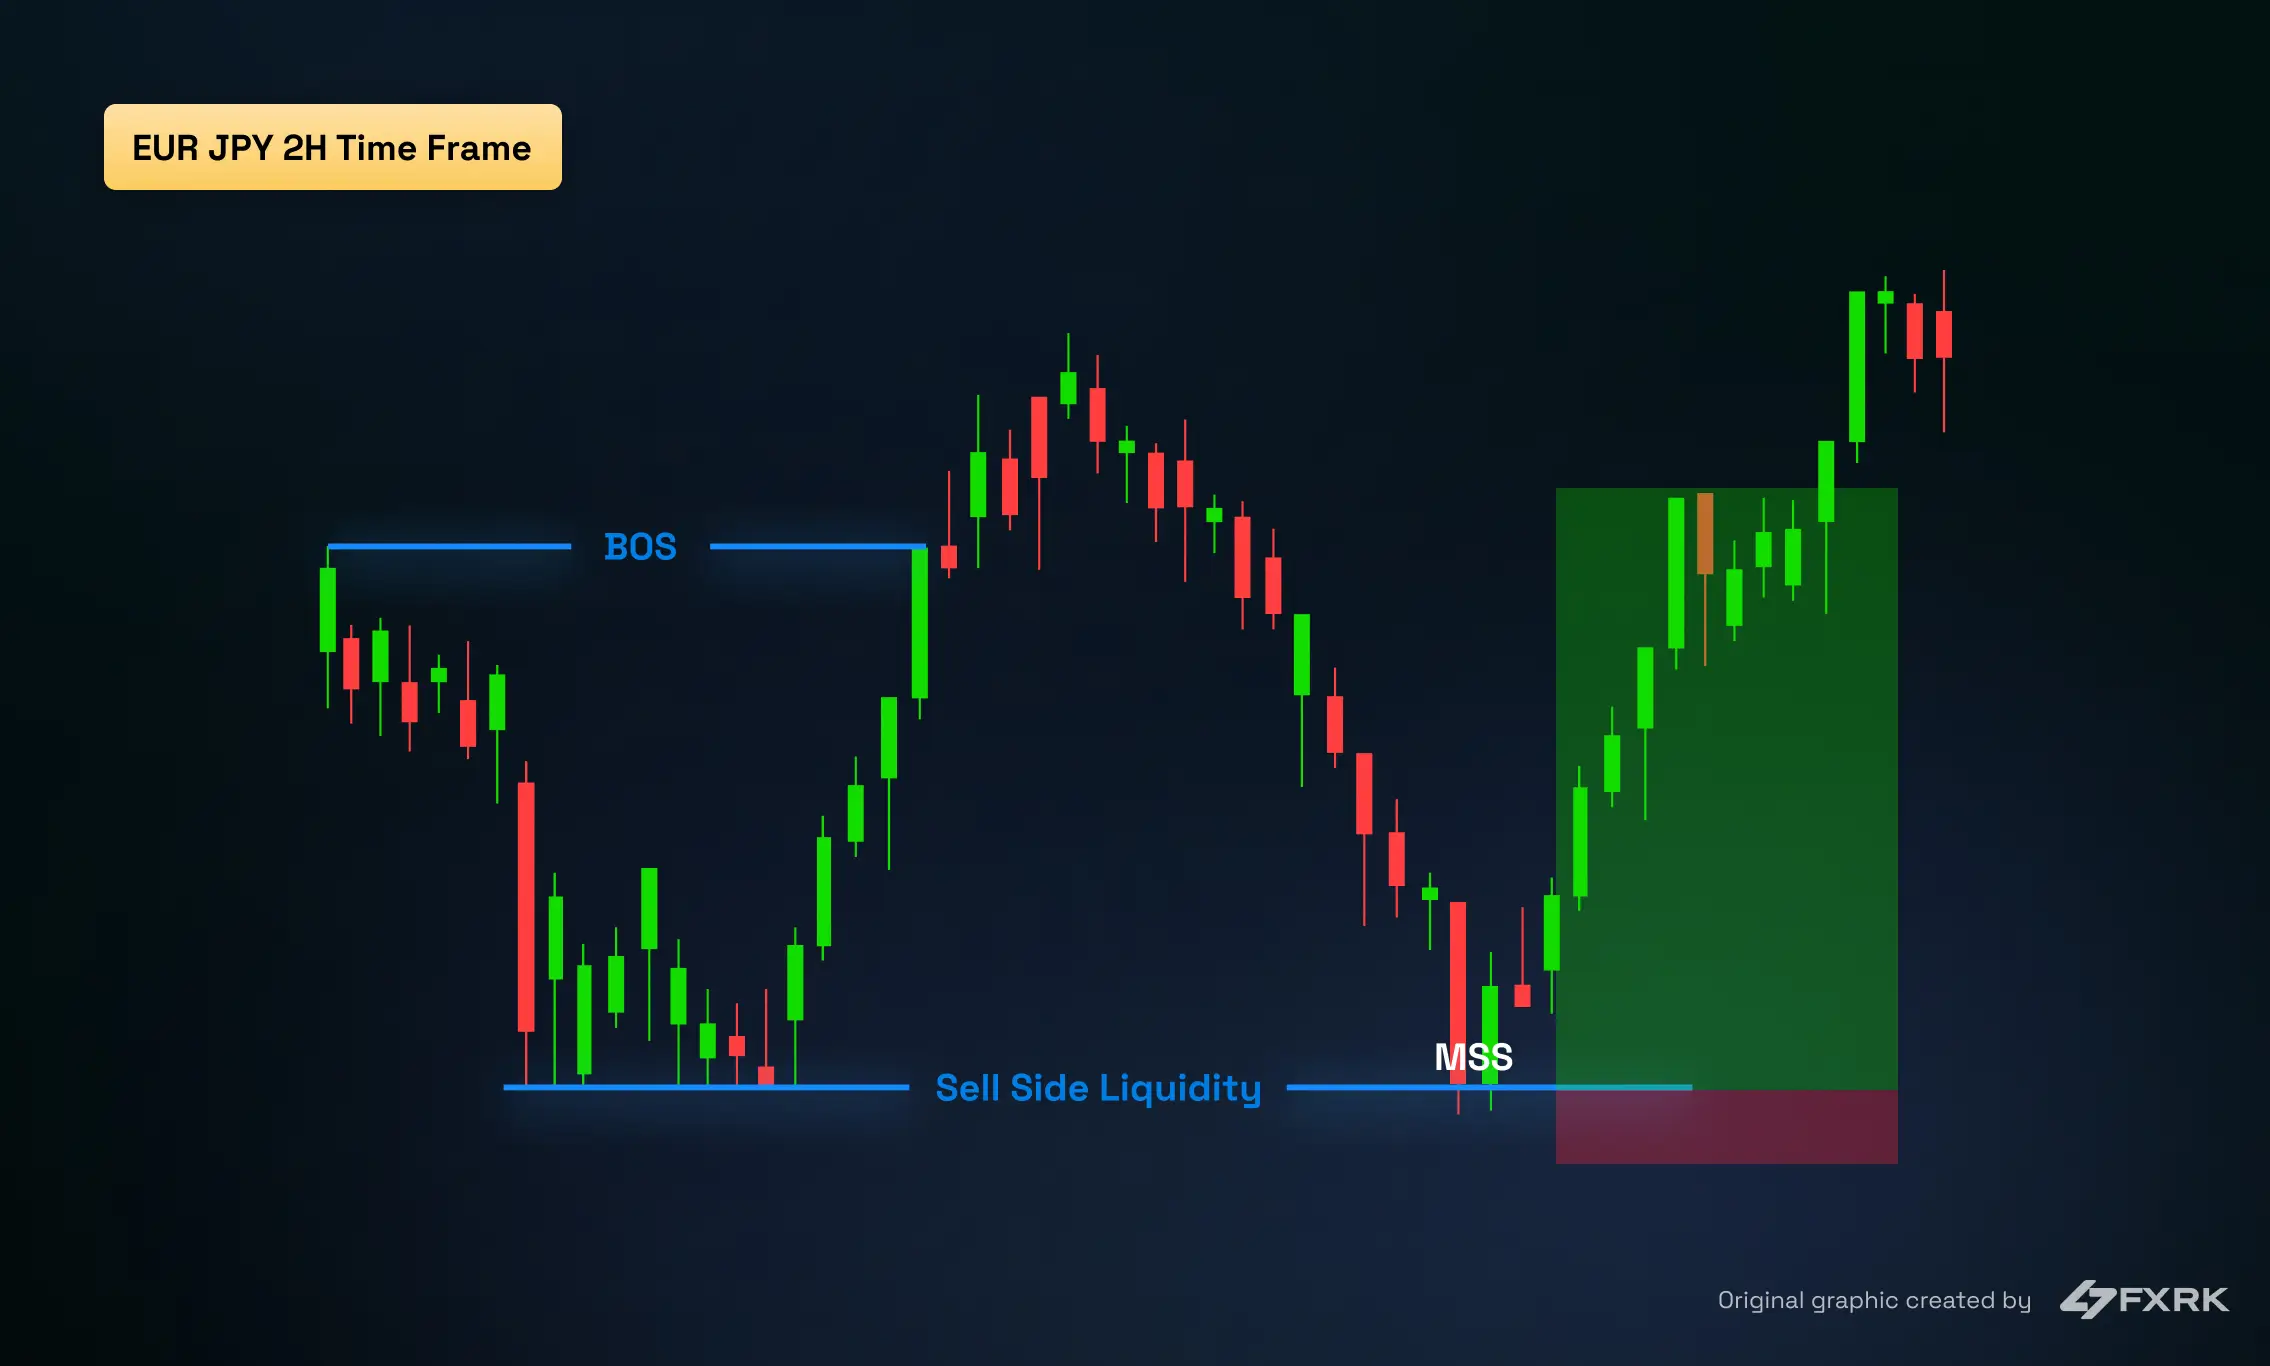
📊 Chart example
The chart shows a perfect Turtle Soup setup where price breaks below a key swing low, triggering sell-side liquidity and trapping breakout traders. It then reverses, forming an opposite bullish candle. The setup occurs after a Break of Structure (BOS), with entry taken on a lower time frame, and the trade delivers a 5.5:1 reward-to-risk ratio.
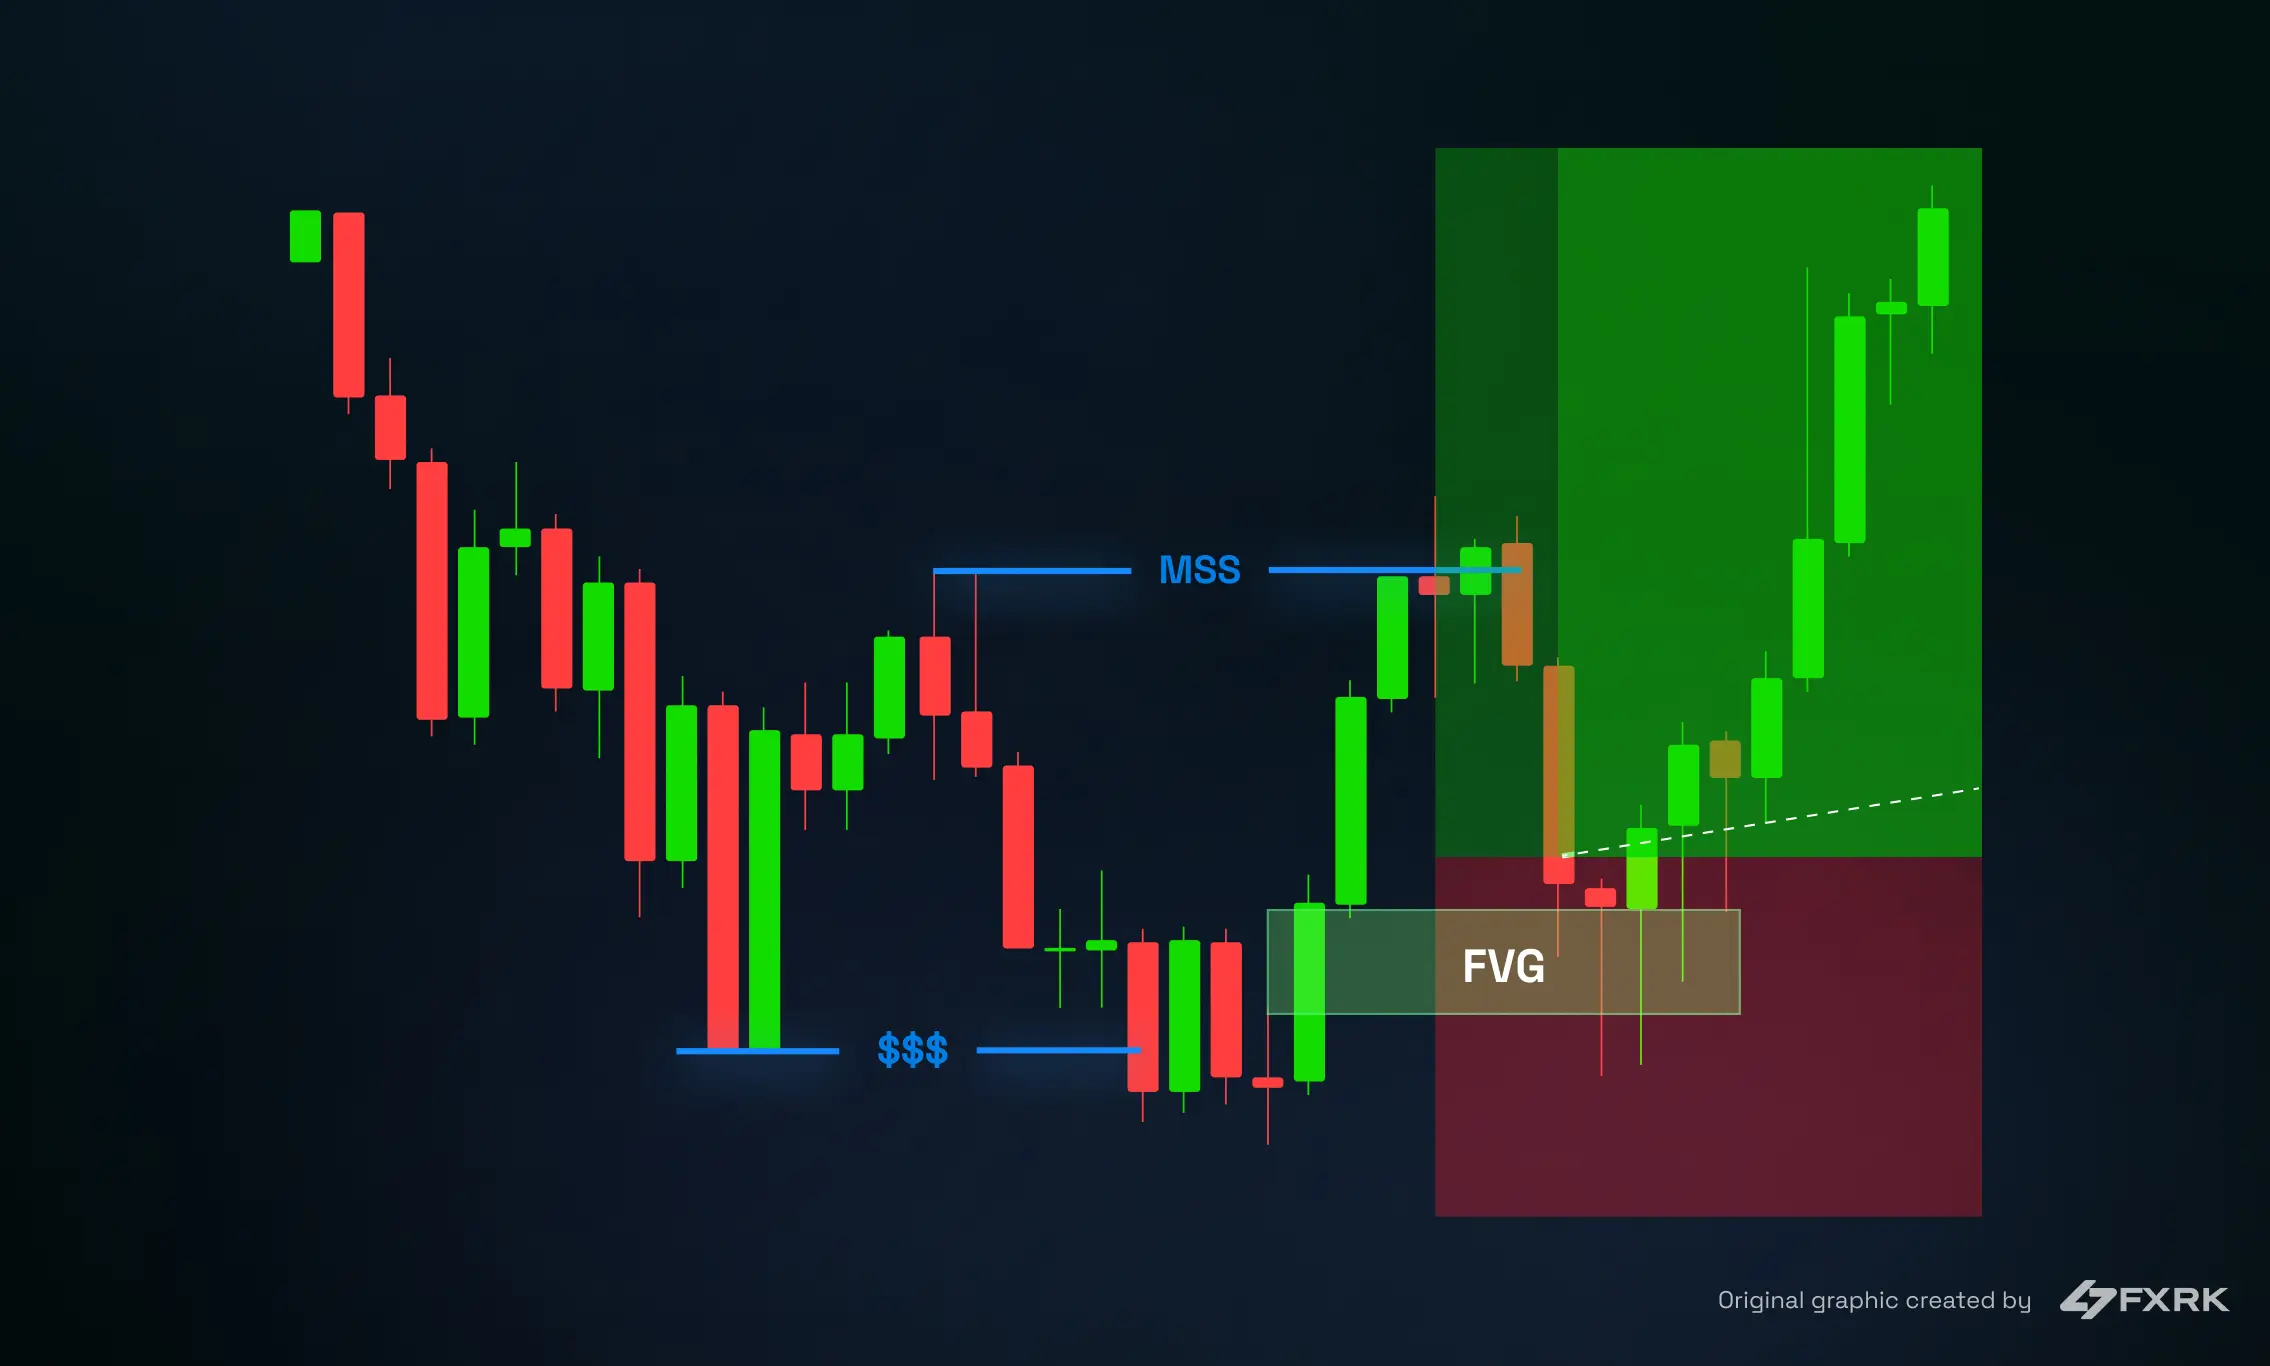
📊 Chart Example 2 – 5-Minute Confirmation:
Zooming into the 5-minute chart, confirmation is provided by a clear market structure shift (MSS) and a strong bullish engulfing candles. The move forms a precise Fair Value Gap (FVG), which serves as the entry zone. The trade also sweeps 5M sell-side liquidity before reversing, providing an ideal low-risk entry with the stop-loss placed just below the last low.
🧠 Putting It All Together: Build Your Strategy the Right Way
After learning about the most effective trading strategies used by successful prop traders, the next step is to build your own complete system. This isn’t about starting from scratch. It’s about bringing everything together: strategy, risk management, and mindset.
Here’s how you can build a solid trading strategy:
🧩 Strategy: Learn, Test, and Adapt
Start by reviewing what you’ve just read. Which strategy aligns with your personality and schedule? Are you more comfortable with trend continuations like the bull flag, or do you prefer reversal patterns like Turtle Soup?
Use demo accounts or backtesting tools like TradingView to test each method. Log your trades, track your results, and identify what works best across different market conditions.
Your goal is to define a trading system with:
✅ Clear entry and exit rules
✅ Preferred timeframes
✅ Proven setups with a solid win rate and reward-to-risk ratio
This foundation becomes your edge, not just for trading but for passing prop firm evaluations.

📉 Risk Management: Stay in the Game
Even with a solid strategy, poor risk management can blow your account. At this stage, your focus should shift to consistency and capital preservation.
Build a risk plan that includes:
✅ Small, consistent position sizes (for example, 0.25% to 0.5% risk per trade)
✅ Daily and weekly maximum loss limits
✅ Pre-set stop losses and take profit levels
✅ Trade journaling and performance reviews
In prop trading, following drawdown rules is critical. Traders who manage risk well are the ones who stay in the game and get the chance to scale.
🧠 Mindset: Master Your Emotions
No system works without mental discipline. Emotional decisions often lead to overtrading, revenge trades, or premature exits.
Build the right mindset by:
✅ Accepting losses as part of the process
✅ Avoiding impulsive trades or overconfidence after wins
✅ Focusing on execution instead of outcomes
The most successful traders treat trading like a business where consistency, review, and routine matter more than raw talent.
🚀 Final Thoughts
By putting all the pieces together, you’re not just copying a strategy. You’re building your own trading system that aligns with your goals, psychology, and trading conditions. That is exactly what prop firms are really looking for.
By following a structured approach that combines a proven strategy, strict risk management, and the right mindset, you significantly increase your chances of passing prop firm challenges and becoming a funded trader.
In the end, strategy is only one pillar. Discipline is what holds everything together.
Are you ready to put your strategy to the test in real markets?
FXRK gives you the tools, funding, and support you need to succeed.
🎯 Get funded now and trade with a reputable prop firm that backs serious traders.

Nuestro Modelo de Afiliación
